EUR/USD Recovery Likely to Remain Limited Amid Weak Economic Data and Political Uncertainty
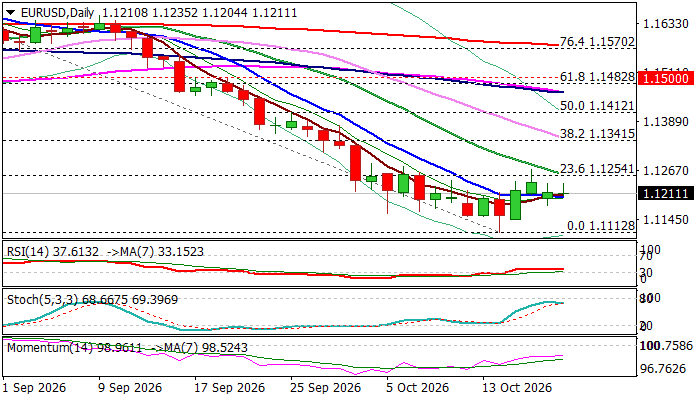
EUR/USD remained supported on Tuesday after recovering from Monday’s gap-lower opening and a brief dip below the 1.1200 mark, with the 10-day moving average helping to contain losses. However, the pair has so far lacked sufficient momentum for another test of the falling 20-day moving average at 1.1257, which capped Friday’s rebound.
The broader technical outlook remains bearish on the daily chart. The 14-day momentum indicator has stayed in negative territory since September 9, while moving averages continue to signal downside risk, with the 55-day and 100-day averages nearing a bearish crossover.
This suggests that the recent recovery from the October 14 low at 1.1112, the weakest level since early April 2025, may prove corrective in nature. The longer-term decline was contained by the 200-week moving average, but the limited rebound leaves the pair vulnerable to renewed weakness.
Political developments in Europe, particularly in France, remain a key driver of the euro and are likely to provide the next directional cues. Despite a calmer political backdrop in France, the single currency has derived only modest support, as incoming economic data continue to weigh on sentiment.
Recent figures showed a sharp contraction in the Eurozone’s current account surplus, which narrowed to €8.7 billion in August from €27.2 billion in July. Economic sentiment also deteriorated, falling to 18.5 in October from 25.8 previously. At the same time, widening spreads between French 10-year government bonds and those of other major Eurozone economies have added to concerns about the region’s outlook.
A break below the 1.1200 support zone would increase the risk of a renewed decline toward the 1.1130/20 area, which includes the 50% retracement of the 1.0177-1.2082 uptrend and the 200-week moving average. A sustained move below this support cluster would reinforce the bearish outlook and signal continuation of the broader downtrend.
On the upside, a break above the 20-day moving average would provide some relief. However, a stronger bullish signal would require an extension above the 1.1320/40 zone, where the June 2024 low and the 38.2% Fibonacci retracement of the 1.1711-1.1112 decline converge.
Res: 1.1235; 1.1257; 1.1311; 1.1340
Sup: 1.1200; 1.1145; 1.1112; 1.1065