Brent Retreats from Crucial $110 Resistance as Trump Eases Sanctions on Russia
Brent crude retreated from a five-month high in early Monday trading after President Trump’s decision to lift sanctions and tariffs on Russia provided temporary relief to global energy markets.
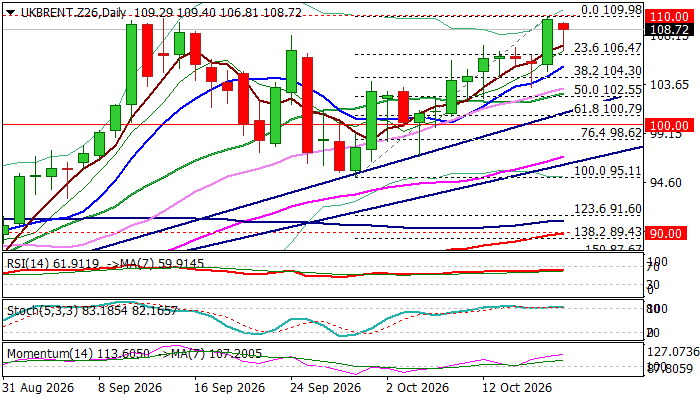
The benchmark surged more than 4% on Friday, reaching the $110 area, a major resistance zone that has repeatedly capped gains since mid-September and also carries significant psychological importance. A sustained break above this level would likely strengthen bullish momentum and further complicate efforts to calm market sentiment, something Trump’s latest policy move appears designed to avoid.
So far, the decline has remained limited. The pullback stalled just ahead of the first Fibonacci support at $106.47, representing a 23.6% retracement of the $95.11-$109.98 rally, before prices rebounded as investors continued to assess the broader implications of the decision.
While the move aims to stabilize energy markets and reduce the risk of further supply disruptions, the underlying drivers of the energy crisis remain largely unresolved. Ongoing conflict in the Middle East, together with sanctions on major oil producers Russia and Iran and severely constrained regional energy flows, continue to underpin elevated crude prices. At the same time, the decision has drawn criticism from opponents who argue that energy policy is being used to gain political support ahead of the midterm elections.
From a technical perspective, the broader bullish outlook remains intact on the daily chart, as the latest pullback has been relatively shallow. However, overbought stochastic readings and a downward-turning RSI suggest that bullish momentum could ease, potentially opening the door to consolidation or a deeper correction.
In the near term, price action may remain range-bound if dips stay limited. A stronger corrective move would come into focus on a break below $106.47 and the rising 10-day moving average at $105.33. As long as Brent remains above $104.30, the 38.2% Fibonacci retracement level, any weakness is likely to be viewed as a healthy correction within the broader uptrend.
Attention remains focused on support at $104.30 and the higher low of $103.40 established on October 15. A break below these levels could weaken the bullish structure and expose the next key supports at the bull trendline near $101.26 and the psychological $100 mark.
Res: 109.40; 110.00; 110.50; 111.48
Sup: 107.27; 106.47; 105.33; 104.30