Dollar Remains on the Back Foot Before U.S. Inflation Report
The U.S. dollar index remained under pressure for a second consecutive week, slipping to its lowest level in nearly three weeks on Wednesday.
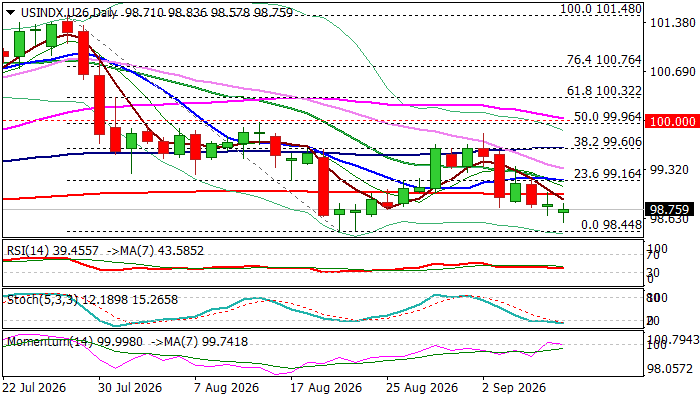
The greenback resumed its broader downtrend after the U.S.-backed intervention to support the yen and bond-buying operations in late July triggered a sharp decline from 101.48 to 99.45, where sellers initially paused their advance.
Bears regained the upper hand after a modest corrective rebound stalled at the 38.2% Fibonacci retracement of the 101.48 to 99.45 decline. The recovery was further capped by the 100-day moving average and a bull-trap formation on the daily chart, reigniting bearish momentum and erasing nearly all of the 99.45 to 99.82 recovery leg.
Technical indicators continue to point lower, with multiple bearish moving-average crossovers, repeated closes below the 200-day moving average, and the 14-day momentum indicator slipping back into negative territory after briefly moving above the midline. These signals keep the focus on the 99.45 August low, with a break below that level likely to accelerate downside pressure.
Attention now turns to Friday’s U.S. August inflation report, a key release that could heavily influence the Federal Reserve’s policy decision next week.
Stronger-than-expected CPI data may provide support for the dollar by reinforcing expectations of a rate hike. However, a sustained recovery would still require a stronger bullish catalyst to reverse the prevailing bearish outlook.
Initial resistance is seen at the broken 200-day moving average at 98.96, followed by the 10-day moving average at 99.14, ahead of the key barrier at 99.60.
On the downside, a decisive break below the 99.45 pivot would confirm a bearish continuation pattern and complete a failure swing on the daily chart, exposing the next targets at 97.82, the base of the weekly cloud, and the 97.40 area, which marked a key higher low in April and May.
Res: 98.96; 99.14; 99.45; 100.00
Sup: 98.44; 97.82; 97.40; 96.81