GBP/USD – Recovery Meets Strong Resistance Near the Key 1.3400 Barrier
Cable remains confined to a narrow trading range for a second straight session following last week’s 1% rally, which completed a bullish reversal pattern on the weekly chart. The broader pullback from 1.3869 was successfully contained by the ascending trendline drawn from the 2022 low at 1.0348, while the pair also secured a positive technical signal by closing above the weekly Ichimoku cloud top at 1.3335.
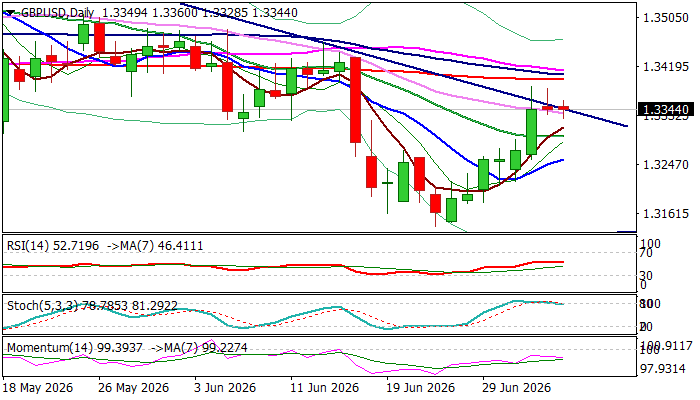
However, the daily chart presents a less constructive picture. Fourteen-day momentum remains in negative territory and is turning lower, while stochastic indicators are retreating from overbought levels. In addition, the long upper shadows on the past two daily candles highlight strong selling pressure ahead of the key 1.3400 resistance zone, where the 200-, 100- and 55-day moving averages converge alongside the 50% retracement of the 1.3653–1.3140 decline and the base of the daily Ichimoku cloud.
The formation of a second consecutive daily Doji candle underscores growing market indecision and raises the risk of further hesitation, with recovery attempts potentially losing traction before reaching the pivotal 1.3400 barrier.
In the near term, a pullback toward the 1.3300 area appears the more likely scenario. This zone, reinforced by psychological support and the 20-day moving average, is expected to attract buyers and preserve the potential for a renewed push higher toward the 1.3400 resistance cluster.
Conversely, a decisive break below 1.3300 would weaken the near-term technical structure and increase the risk of a deeper corrective decline.
Res: 1.3385; 1.3400; 1.3412; 1.3460
Sup: 1.3330; 1.3300; 1.3256; 1.3212