BRENT OIL – Downtrend Faces Initial Support at the 200DMA
Brent crude has fallen more than 15% over the past four trading sessions as optimism surrounding a potential US-Iran peace agreement accelerated the recent selloff, bringing prices close to levels seen before the outbreak of the conflict.
Growing expectations that hostilities may soon come to an end and avert a prolonged disruption to traffic through the Strait of Hormuz have significantly reduced the geopolitical risk premium embedded in oil prices. Markets have responded positively despite the absence of a detailed peace framework, with current developments centered on a memorandum of understanding that could pave the way for formal negotiations. At the same time, investors remain mindful of shifting rhetoric from Washington, ranging from declarations that the conflict is nearing an end to renewed threats of military action.
Brent extended its decline with a 5% drop on Tuesday, while attempts to push prices lower in Wednesday’s session were repeatedly contained by the 200-day moving average at $77.86.
This key technical support, combined with deeply oversold daily indicators, suggests that bearish momentum may temporarily lose steam, increasing the likelihood of profit-taking and a corrective rebound in the near term.
However, the broader technical outlook remains negative. Daily studies continue to favor a bearish scenario, with any recovery likely to be corrective in nature before sellers attempt another move lower. The medium-term outlook has also been weighed down by the latest projections from the International Energy Agency, which forecast a substantial supply surplus in 2027, with global oil supply expected to exceed demand by a wide margin. The agency estimates supply growth of approximately 8 million barrels per day versus demand growth of only 2 million barrels per day.
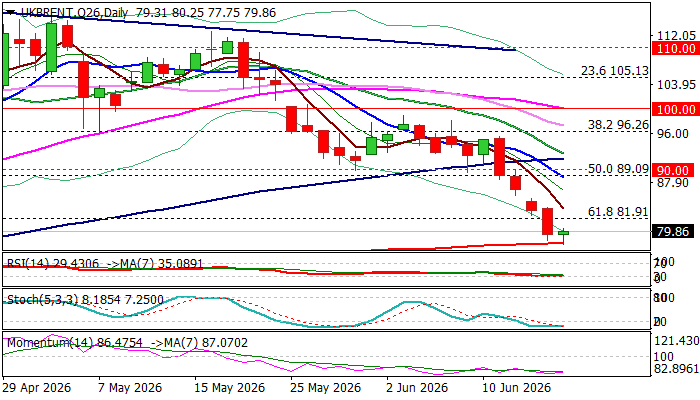
On the upside, the broken 61.8% Fibonacci retracement at $81.91 marks initial resistance, followed by Monday’s high at $85.29, which was established after the gap-lower opening at the start of the week. Above that, former support levels at $89.00/$90.00—comprising the broken 50% retracement of the $58.70-$119.47 rally, reinforced by the falling 10-day moving average and the psychological $90 barrier—are expected to act as strong resistance. Any extended recovery is likely to be capped within this zone, preserving the broader bearish structure and setting the stage for renewed downside pressure.
A sustained break below the 200-day moving average would strengthen the bearish outlook and expose the next downside target at $73.04, the 76.4% Fibonacci retracement of the broader advance, ahead of the key psychological support at $70.00.
Res: 81.91; 83.75; 85.29; 86.50
Sup: 77.86; 75.76; 73.04; 70.00