USD Index Remains Under Pressure Near Key Technical Support Zone
The US dollar index is stabilizing after Friday’s nearly 0.5% decline, triggered by weaker-than-expected US nonfarm payrolls data that dampened expectations for further Federal Reserve rate hikes and weighed on the greenback.
Market participants are now turning their attention to Wednesday’s US July inflation report for additional clues on the Fed’s policy outlook.
Economists anticipate softer inflation readings in July, largely reflecting the impact of the recent US-Iran ceasefire. A weaker-than-expected outcome could add further downside pressure on the dollar.
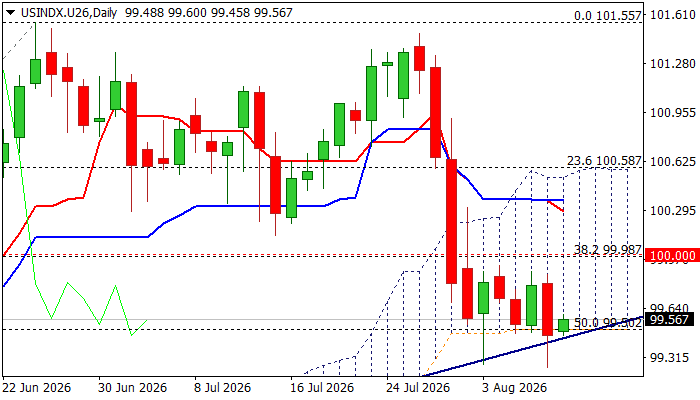
In the near term, price action remains centered around the critical 99.50 support area, which is reinforced by the 50% retracement of the 97.44-101.55 rally, the daily cloud base, and a bullish trendline. This zone has so far managed to withstand several downside attempts.
The broader technical picture remains bearish, with strong negative momentum and multiple bearish moving average crossovers continuing to weigh on sentiment.
A decisive break below the 99.50 support zone, along with the recent low at 99.25, would confirm bearish continuation and open the way toward the next major support at 99.00, where the 200-day moving average converges with the 61.8% Fibonacci retracement.
On the upside, the 99.90-100.00 region represents a key resistance barrier, capped by recent congestion highs, a declining 10-day moving average, and the psychologically important 100 level. A sustained move above this area would weaken the bearish outlook and force sellers to the sidelines.
Res: 99.90; 100.00; 100.25; 100.40
Sup: 99.50; 99.25; 99.00; 98.67