U.S. Dollar Index Reaches New High for 2026
The U.S. dollar index remains supported by a combination of bullish drivers, including growing expectations of a more hawkish Federal Reserve stance as higher oil prices add to inflationary pressures, heightened risk aversion that reinforces demand for safe-haven assets, and a sharp bond market selloff that has lifted the benchmark 10-year Treasury yield to its highest level since 2022.
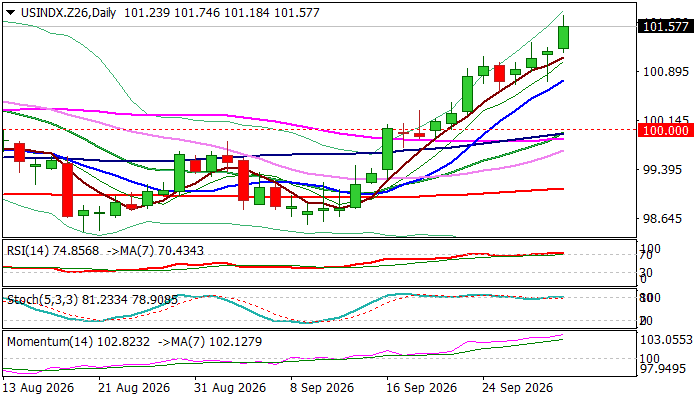
Thursday’s rally broke through the key resistance zone at 101.48/55, marked by the July 28 and June 24 peaks and representing the highest levels of 2026. The move generated an initial signal that the broader uptrend from the late-January lows is resuming, although a daily close above this barrier is still needed to confirm the breakout.
The index has been advancing steadily for a third consecutive week and closed September with gains of nearly 2%, fully retracing the previous two-month decline from 101.48 to 98.44.
Bullish daily indicators continue to support the positive outlook, though overbought conditions and a bearish divergence on the stochastic oscillator suggest that upward momentum may begin to encounter stronger headwinds near the 101.48/55 resistance area.
On the downside, the recently broken 38.2% Fibonacci retracement of the 110.00/95.35 decline at 100.95 is expected to provide solid support and help preserve the broader bullish structure.
A decisive break above the 101.48/55 barrier would strengthen the bullish case and open the way toward 101.80, the May 12, 2025 high, followed by 102.67, the 50% retracement of the 110.00/95.35 downtrend.
Res: 101.80; 102.00; 102.67; 103.00
Sup: 101.18; 100.95; 100.75; 100.48