Brent Oil Pulls Back as Bulls Lose Momentum Near $90 Resistance
Brent crude climbed to its highest level in more than a week on Tuesday, extending Monday’s near 5% rally after fresh comments from President Trump shifted market sentiment and overshadowed ongoing efforts by Iran and Oman to secure the reopening of the strategic Strait of Hormuz.
The latest demands from President Trump prompted Iran to suspend negotiations with the current US administration until the end of his term in 2029, adding a new layer of geopolitical uncertainty to energy markets.
However, investors have increasingly learned to navigate the frequent flow of conflicting headlines, becoming more selective in assessing the market implications of developments linked to the so-called “Trump indicator.”
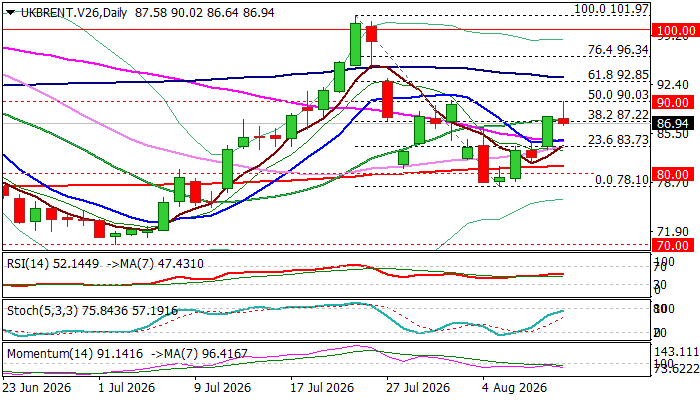
From a technical perspective, the daily chart continues to present a mixed picture. While moving averages have shifted toward a broadly bullish setup, the 14-day momentum indicator remains in negative territory, partially offsetting the positive signal generated during Tuesday’s rally. Brent briefly broke above the psychological $90 level, which also marks the 50% Fibonacci retracement of the $101.97/$78.10 decline, but the swift reversal that followed suggests bullish momentum may be fading.
Renewed weakness, with prices falling more than $3 during the mid-European and early US sessions on Tuesday, pushed Brent below the important $87.22 support area, defined by the broken 38.2% Fibonacci retracement and the 20-day moving average. A sustained break below this level would strengthen the case for a deeper correction and increase the risk of a full reversal of the recent recovery, particularly if geopolitical tensions ease or market sentiment shifts.
Conversely, a limited pullback that holds above $87.22, or finds support ahead of the $85.00 area near the bullish crossover of the 10-day and 55-day moving averages, would keep the recovery scenario intact. Such a development would preserve the potential for another challenge of the $90 resistance zone and expose higher targets at $92.85 and $93.28, where the daily cloud top, the 61.8% Fibonacci retracement, and the 100-day moving average converge.
Res: 88.57; 90.00; 92.85; 93.28
Sup: 86.50; 85.00; 84.65; 83.73