GBP/USD Eyes Breakout as Key Resistance Zone Comes Under Pressure
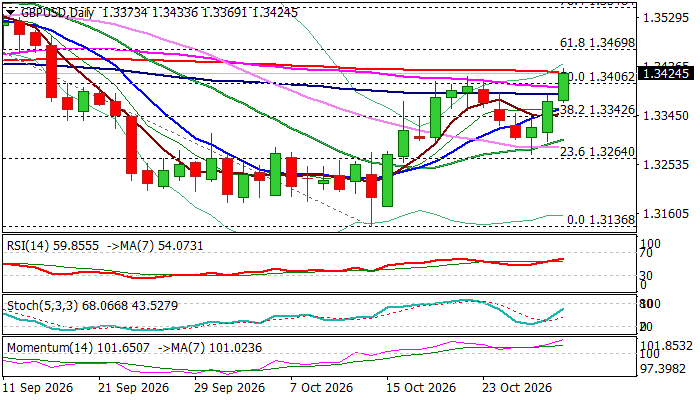
GBP/USD extends its advance for a third consecutive session, once again testing the key resistance area around 1.3406, which marks the 50% Fibonacci retracement of the 1.3675–1.3136 decline, and 1.3418, the October 22 high.
A softer U.S. dollar, pressured by growing concerns surrounding AI-related stocks, has helped sterling climb to a three-week high and challenge the next important barriers at 1.3428, represented by the 200-day moving average, and 1.3440, the top of the daily Ichimoku cloud.
This resistance zone capped gains last week, triggering a sharp pullback after the pair briefly touched 1.3418. However, renewed upside momentum suggests the barrier is coming under increasing pressure, with a sustained break above the area expected to reinforce the broader recovery from the 1.3136 low.
The pair remains on track for a third consecutive weekly gain and is also heading toward a positive monthly close, supporting a constructive near-term outlook.
A daily close above the 1.3406 Fibonacci level is considered the minimum requirement to maintain the current bullish structure.
Technical indicators on the daily chart continue to favor the upside, with strong positive momentum and a widening bullish divergence between the Tenkan-sen and Kijun-sen following a recent bullish crossover.
The next upside targets are located at 1.3469, the 61.8% Fibonacci retracement level, followed by the psychological 1.3500 mark.
On the downside, another rejection from the 1.3406–1.3440 resistance zone could expose the pair to a deeper corrective pullback, particularly if prices fall below the 100-day moving average at 1.3385, which would weaken the near-term bullish outlook.
Res: 1.3440; 1.3469; 1.3500; 1.3530
Sup: 1.3406; 1.3385; 1.3360; 1.3342