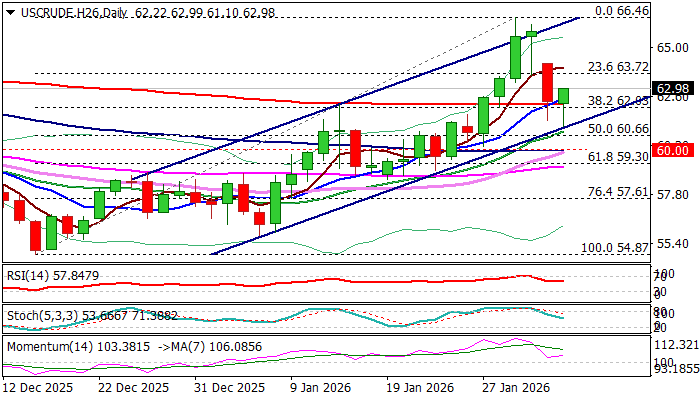
WTI OIL – repeated bounce off key support suggests pullback from multi-month high may have ended
WTI crude extended its pullback from the recent multi-month high of $66.46 during early Tuesday trading, following a gap-lower opening at the start of the week and Monday’s sharp 4% decline, marking the largest single-day drop since November 11.
Signs of easing U.S.–Iran tensions reduced supply concerns and triggered heavy selling, while a firmer dollar added pressure on prices.
Although Tuesday’s further decline highlighted the risk of a deeper correction of the $54.87–$66.46 recovery leg, additional technical confirmation is still needed to validate the move.
The price has tested key support levels at $62.21/$62.03 (200-day moving average and 38.2% Fibonacci retracement of $54.87–$66.46) twice but has been repeatedly rejected, signaling a healthy correction before larger bulls regain control.
This view is reinforced by a double bear-trap beneath the 200-day moving average, multiple bullish moving average crosses, and positive momentum indicators.
A sustained close above the 200-day moving average would provide an initial bullish signal, while a push above the $64.00 zone would strengthen the bullish structure, paving the way to fill Monday’s gap and retest key resistance levels at $66.40–$66.46 (September 26 and January 29 highs), confirming a potential reversal.
Res: 63.00; 63.72; 64.00; 64.66
Sup: 62.50; 52.21; 62.03; 61.10