WTI Crude Oil – Daily Indicators Suggest Potential Halt to Recent Decline
WTI crude oil remained under pressure on Thursday but showed signs of slowing its decline compared to the sharp drop in recent sessions, which saw prices fall by around four dollars.
The market continues to weigh key factors, including increased US oil production driven by policy shifts under the Trump administration and a stabilized geopolitical landscape in the Middle East.
Additionally, the prospect of global trade tariffs, particularly targeting the EU, could further suppress oil demand, adding to market uncertainty. An unexpected rise in US crude inventories, as reported by the API, also contributed to the negative short-term outlook.
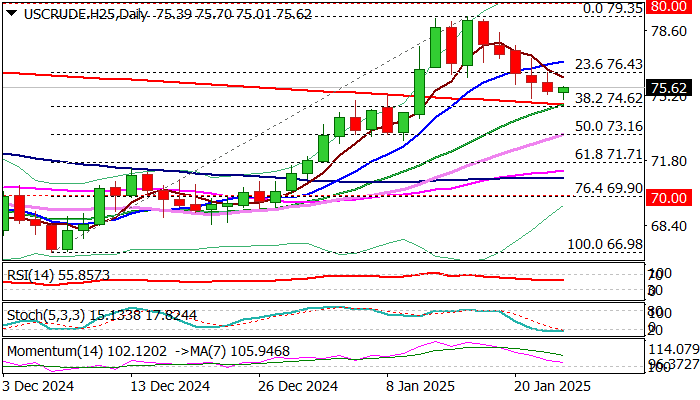
While fundamental pressures remain, the technical outlook shows some resilience. Daily indicators suggest a more supportive setup, with moving averages maintaining a bullish alignment and momentum still in positive territory. Strong support is evident around the $74.70 zone, reinforced by the 38.2% Fibonacci retracement of the $66.98 to $79.35 rally and the converging 20- and 200-day moving averages, which are nearing a bullish golden cross.
The current daily candle, shaping up as a Doji, hints that the near-term bearish momentum from the $79.35 peak may be weakening.
For a bullish reversal signal to materialize, WTI needs to clear several levels: the $76.00 zone (the base of the thick 4-hour Ichimoku cloud), the broken 23.6% Fibonacci level at $76.43, and the 10-day moving average at $76.98.
Failure to achieve these gains could suggest that the bears are merely pausing before attempting another leg lower. A decisive break below the 200-day moving average, however, would confirm a continuation of the bearish trend.
Res: 76.09; 76.43; 76.98; 77.18
Sup: 75.01; 74.76; 74.62; 74.02