WTI crude oil continues its decline as hawkish Federal Reserve minutes stoke worries about demand
WTI crude oil prices continue their downward trajectory for the fourth consecutive day, pressing against a fresh three-month low of $76.42 established in the previous session.
Short-term market sentiment took a hit following the release of minutes from the Federal Reserve’s latest policy meeting. While policymakers expressed hopes of easing inflationary pressures, indications that the first rate cut might be further delayed and the possibility of another rate hike not being ruled out entirely conveyed a largely hawkish message.
Investors maintained their short positions, fearing that the Fed’s hawkish stance could dampen demand prospects. Despite a surge in gasoline demand in the US to multi-month highs, oil prices have yet to see significant positive impacts.
However, economists retain cautious optimism, anticipating that the upcoming summer driving season will bolster global demand growth.
Attention now turns to the OPEC+ meeting scheduled for June 1, where members will deliberate on extending the current production cut of 2.2 million barrels per day.
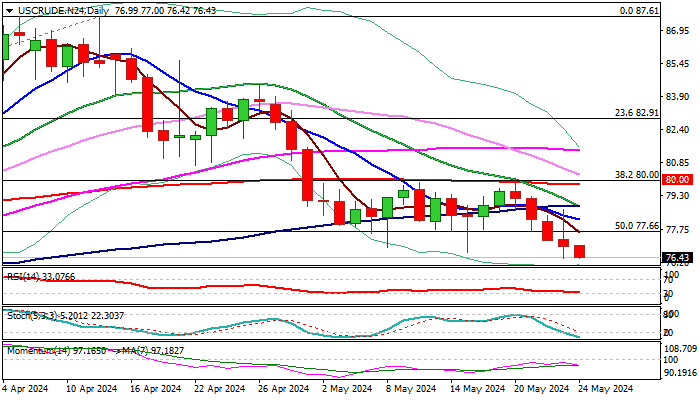
On the technical front, the daily chart presents a firmly bearish outlook, with a double-top formation completed and a lower support platform around the $80.00 psychological level and 200-day moving average. The WTI contract is poised for a weekly loss of approximately 3.7%, closing below the 50% retracement level of the rally from $67.70 to $87.61, signaling a double failure and the formation of a weekly bearish engulfing pattern.
Bears are eyeing targets at $75.54 and $75.31, representing the 200-week moving average and Fibonacci 61.8% retracement level, respectively. A breach of these levels would generate fresh bearish signals.
However, oversold conditions suggest that bears may pause in the coming sessions before resuming their downward pressure.
The broken Fibonacci 50% level now acts as initial resistance at $77.66, followed by the confluence of the 20-day and 100-day moving averages at $78.87, expected to cap any extended upside movements.
A sustained break above the pivotal $80.00 resistance zone would mark a significant shift in the market dynamics.
Res: 76.89; 77.66; 78.87; 80.00
Sup: 76.10; 75.54; 75.31; 75.00