USDJPY – Bears Maintain Control and Break Through Key Support Zone
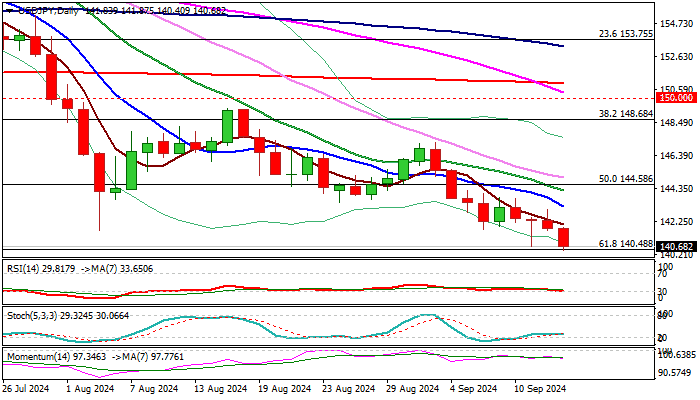
USDJPY remains firmly in the red, breaking through the crucial Fibonacci level at 140.48 (61.8% retracement of 127.22/161.95) and the upper boundary of the 140.48/00 key support zone. This decline has overshadowed the positive signal from Wednesday’s long-tailed daily candlestick.
The pair is set for another weekly loss, with the long upper shadow on the weekly candlestick indicating strong selling pressure and reinforcing bearish expectations.
The daily chart presents a clearly bearish outlook, marked by strong negative momentum, the price being constrained by a descending Ichimoku cloud, and moving averages in a bearish setup, including a 55/200DMA death cross.
A decisive break below the 140.48/40 support levels would signal a stronger bearish trend, potentially extending towards the 137.23 trough (July 2023 low).
Resistance from the falling 10DMA (143.22) is likely to limit any upward movements, maintaining the overall bearish sentiment.
Res: 141.68; 142.08; 143.04; 143.22
Sup: 140.25; 140.00; 138.60; 137.23