USD/JPY – Weekly Inverted Hammer Signals Potential Loss of Bearish Momentum Near Key Fibonacci Support Zone
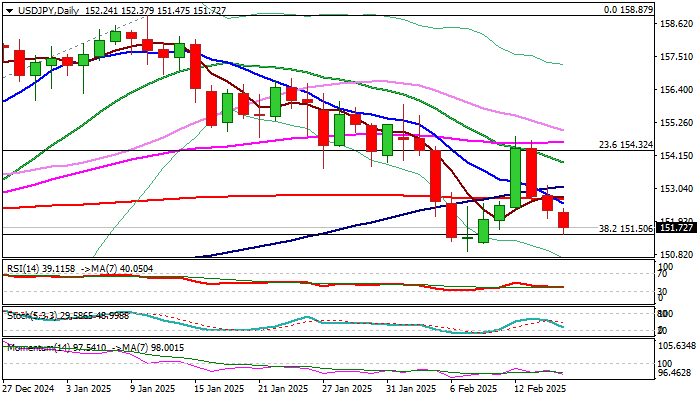
USD/JPY continues its decline for the third consecutive day, testing the key Fibonacci support at 151.50 (38.2% of 137.57/158.87).
The recent dip found support at this level, reinforcing the zone and suggesting the possibility of a rebound, adding to the case for a healthy correction before broader bullish momentum resumes.
While daily indicators remain negative, with strengthening bearish momentum and the formation of a death cross between the 10/200 DMA signaling potential further downside, the weekly chart shows an inverted hammer candlestick, indicating the potential for a bounce.
In this scenario, bulls will encounter several key resistance levels, including the 200DMA at 152.73 and the more significant base of the daily Ichimoku cloud at 153.76. A break above these levels would be necessary to trigger a reversal and open up the next resistance zones at 154.80/90 (Feb 12 lower high / 50% retracement of the 158.87/150.93 move).
Keep an eye on the 151.00 zone for clues on the next directional move.
Res: 152.37; 152.73; 153.12; 153.76
Sup: 151.50; 150.93; 150.00; 149.22