The dollar index is expected to maintain a positive outlook as long as it holds above the key 100 support level
The dollar index remained confined within a tight range on Friday, trading a few hundred pips below the recent one-month high of 101.76, yet maintaining a bullish stance above the critical 100 level.
The index is set for a second consecutive daily close above the psychological 100 support and a fourth straight weekly gain. However, the long upper shadow on this week’s candle indicates increasing selling pressure, especially as weaker-than-expected US economic data have fueled expectations of further Fed rate cuts, partially offsetting the positive sentiment from signs of a potential resolution to the US-China trade dispute.
Technical signals on the daily chart are mixed and lack clear direction, while the weekly chart shows a predominantly bearish structure, marked by strong negative momentum and moving averages in a solid bearish configuration with multiple bearish crossovers. This setup suggests that the recovery from the 2025 low of 97.65 may be losing momentum.
Market attention will be centered on the Federal Reserve’s actions in the coming months. The outlook remains uncertain, as softer economic data and lower inflation in April support the case for policy easing, but economists caution that the full impact of US tariffs is yet to be seen and could potentially drive inflation higher, complicating the Fed’s decision-making.
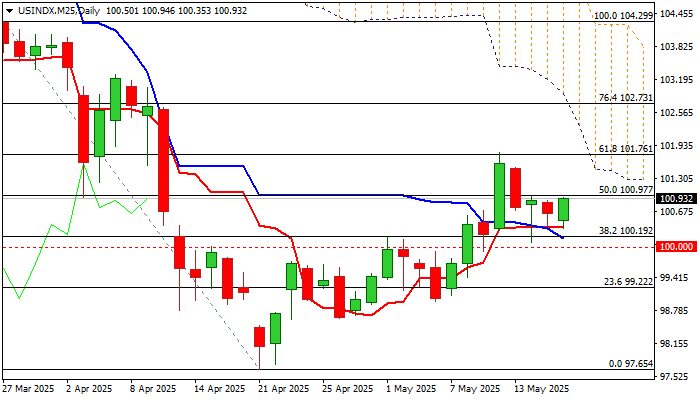
Former key resistance levels at 100.19/00 (broken 38.2% Fibonacci retracement of 104.29/97.65 and psychological support) have now turned into strong support areas, expected to limit the downside and support renewed bullish attempts. A clear break above the 101.80 barrier (last Monday’s peak / 61.8% Fibonacci retracement of 104.29/97.65) would provide an initial signal of bullish continuation, targeting 102.73/93 (76.4% Fibonacci level / base of the descending daily cloud).
Res: 101.23; 101.76; 102.00; 102.73
Sup: 100.37; 100.00; 99.22; 98.95