Oil prices remain under pressure due to demand concerns and an increase in OPEC production.
Oil prices continued to decline in early Monday trading, extending Friday’s 3% drop, which marked the biggest daily loss since August 14.
The sentiment has further weakened due to renewed concerns about demand from the U.S. and China, the partial reopening of Libya’s oil facilities, and OPEC’s decision to increase production by 180,000 barrels per day in October, partially reversing their previous cut of 2.2 million bpd.
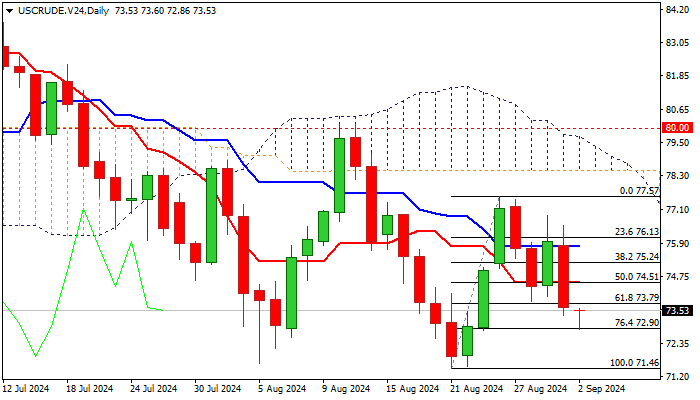
Weak technical indicators on the daily chart, including strong negative momentum and moving averages returning to a full bearish configuration, reinforce the bearish near-term outlook.
The fresh decline has breached the pivotal Fibonacci support at $72.90 (76.4% retracement of the $71.46 to $77.57 rally). A firm break below this level could pave the way for a retest of the key support at $71.46 (the August 21 low, the lowest since February 5).
Last week’s bearish candlestick, with a long upper shadow, signals strong selling pressure, adding to the downside risk. However, the tight Doji candle for August partially offsets these negative signals.
The broken 61.8% Fibonacci support at $73.79 now acts as initial resistance, with any extended upticks likely to be capped below the daily Tenkan-sen and the broken 50% retracement level at $74.51, keeping the broader bearish trend intact.
Res: 73.79; 74.51; 75.24; 75.80
Sup: 72.90; 72.19; 71.66; 71.46