GBPUSD – recovery must break through the 1.27 resistance zone to signal continuation
Share
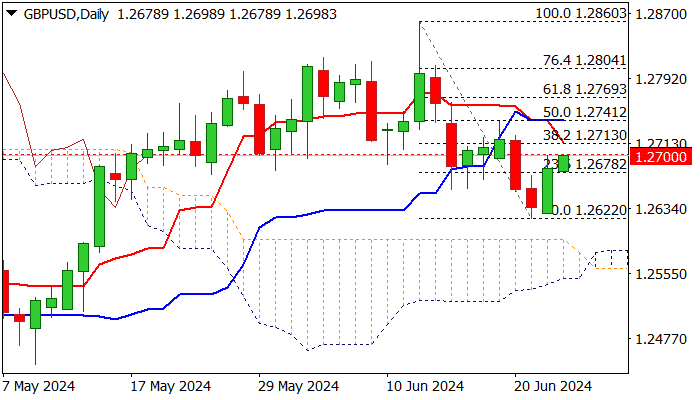
GBPUSD remains bullish in early Tuesday trading, building on Monday’s 0.43% rebound, which formed a bullish engulfing pattern on the daily chart.
However, fresh bullish momentum faces strong resistance around the 1.2700 level (a psychological barrier supported by the 10DMA) and the nearby 38.2% Fibonacci retracement of the 1.2860/1.2622 drop, further reinforced by the daily Tenkan-sen (1.2713).
The daily chart shows a bearish crossover of the Tenkan-sen and Kijun-sen and still negative momentum, suggesting potential for the recovery to stall.
The setup of daily moving averages is mixed, but the daily cloud, which is below the price and thickening, offers support.
A sustained break above the 1.2700/13 zone would confirm the initial bullish signal and pave the way for further recovery.
Conversely, if fresh bullish momentum fails to break higher, an initial negative signal could emerge with a close below the broken 23.6% Fibonacci barrier (1.2678), exposing lower pivots at 1.2641/22 (100DMA / June 21 low).