GBP/USD – Initial signs of a reversal are emerging above the thickening daily cloud on the daily chart
Share
GBP/USD edged higher in European trading on Friday ahead of the release of US inflation data, the key economic event of the day. The better-than-expected UK Q1 GDP numbers also contributed to the improving sentiment.
The technical picture shows conflicting signals from daily indicators, with 14-day momentum remaining in negative territory, moving averages in a mixed setup, and a thickening daily Ichimoku cloud continuing to underpin near-term action.
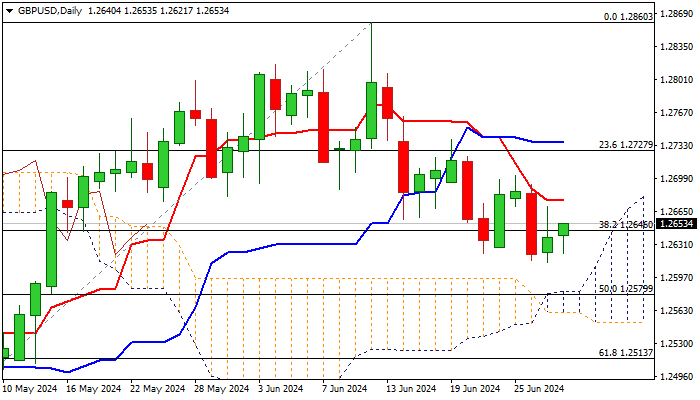
Recent downside attempts have been contained by the 55DMA, just above the rising cloud top, which suggests initial signals of basing. The current extended sideways movement points to consolidation before bulls regain traction.
This notion is supported by the formation of a weekly inverted hammer, though the verification of an initial bullish signal will require a lift and close above pivotal barriers at 1.2670 (10DMA) and 1.2702 (June 25 lower top). This would shift the near-term focus higher and expose targets at 1.2736/65.
Caution is warranted for a break through the daily cloud (currently spanning between 1.2582 and 1.2561), which would revive bearish sentiment and risk a deeper fall.