EURUSD – upcoming daily Ichimoku twist points to additional downside
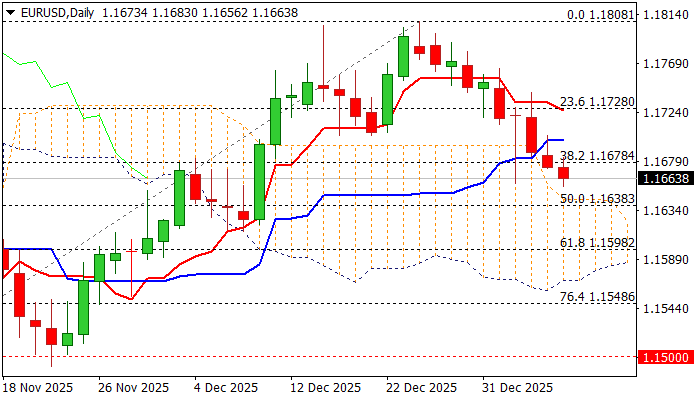
The Euro continues its downward leg from the December 24 peak at 1.1808, where the larger rally had been capped by the 76.4% Fibonacci retracement of the 1.1918–1.1468 range. The pair is now attempting to establish itself below the critical 38.2% Fibonacci level at 1.1678 (measured from the 1.1468–1.1808 rally).
EURUSD is on track for a second consecutive daily close beneath this level, which would confirm a fresh bearish signal. The decline is progressing along the top of a thinning daily cloud, which is expected to twist later next week and continue acting as a technical magnet.
Bears are targeting 1.1638 (50% Fibonacci / 55-day moving average) and 1.1623–1.1615 (cloud twist / daily higher base from December 8–9), although they face resistance at the 100-day moving average near 1.1663, where Monday’s attempt to push lower was strongly rejected.
The oversold stochastic suggests that consolidation could precede further downside, supported by daily studies aligned bearishly, including a double-top formation, negative momentum, and multiple bearish DMA crosses (10/20, 5/10, 5/20, 5/30).
Any short-term rallies are likely to be capped below 1.1700 (former higher base), while a sustained break above the 1.1730 zone (broken 23.6% Fibonacci / 20- and 10-day DMAs) would invalidate the bearish scenario and relieve downward pressure.
Res: 1.1683; 1.1800; 1.1730; 1.1765
Sup: 1.1638; 1.1615; 1.1598; 1.1562