EUR/GBP – The sharp bearish move may pause near support at the base of the daily cloud
Share
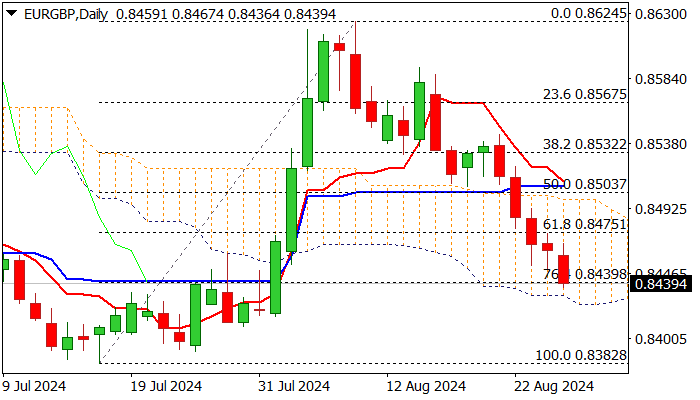
EUR/GBP broke below the Fibonacci support at 0.8439 (76.4% retracement of the 0.8382/0.8624 rally) and is now testing the strong support at 0.8424 (base of the thick daily cloud) as it extends a five-day steep decline from the 0.8544 lower high (August 21).
The daily chart remains firmly bearish, indicated by strong negative momentum and multiple moving average bear crosses. However, oversold conditions and the long lower wicks on the last two daily candlesticks suggest that bears may encounter increased resistance near the cloud base.
Any recovery is likely to be limited, offering better selling opportunities. The first resistance stands at 0.8469 (55-day moving average), followed by the more significant 0.8500 zone (top of the daily cloud, converging 10/100-day moving averages nearing a bear cross, and the broken 50% retracement level), which should cap stronger corrective moves.
The pair is on track for a second consecutive monthly close below the 200-month moving average, while the long upper shadow on the monthly candlestick signals strong selling pressure, reinforcing the bearish outlook.