Dollar Index – Bears pause for a limited correction ahead of key U.S. data releases.
The dollar index extended its recovery for a second consecutive day, supported by short covering as it approaches key support levels in the 100.29/21 zone (December 2023 low and 200-week moving average).
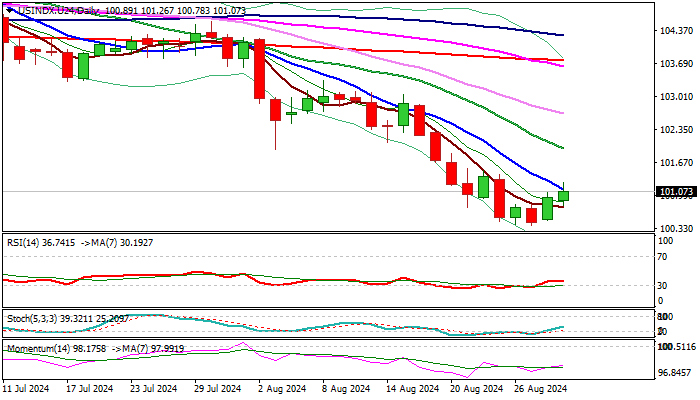
Oversold conditions on the daily chart contributed to this rebound, with the stochastic and RSI indicators emerging from oversold territory. Additionally, a bullish divergence in the stochastic suggests a potential short-term recovery.
However, this bounce is likely a temporary positioning before another push lower, as the dollar remains under pressure from expectations of a Fed rate cut in September, strongly hinted at by recent dovish comments from Fed Chair Powell.
Markets have fully priced in a 25 basis point cut, with increasing speculation about a more aggressive 50 basis point cut, which could limit the current recovery.
Key U.S. economic data due today (Q2 GDP and jobless claims) and on Friday (PCE price index, the Fed’s preferred inflation measure) are expected to provide further insights that could influence the Fed’s decision on the size and pace of rate cuts.
The dollar index remains in a broader downtrend and is on track for its largest monthly loss since November 2023, suggesting that any correction is likely to be limited, providing better opportunities to rejoin the broader bearish trend.
The technical outlook remains bearish on the daily chart, with negative momentum and moving averages in a bearish configuration. The cracked 10-day moving average (101.13) has so far posed significant resistance to recovery attempts and is expected to cap further gains.
Stronger upticks should ideally remain capped below the pivotal 101.95 level (falling 20-day moving average and former August 5 low) to maintain the broader bearish outlook and set the stage for a final attack on key supports at 100.29/00.
Res: 101.26; 101.50; 101.73; 101.95
Sup: 100.78; 100.29; 100.00; 99.20