Crude Oil heads for its largest weekly rally in four years, with the psychological $100 level coming into focus as the geopolitical landscape continues to deteriorate
WTI crude oil surged above $86 per barrel on Friday, extending its sharp rally into a fifth consecutive session and putting the market on track for its strongest weekly advance since early 2022, when the conflict in Ukraine first erupted.
Mounting concerns over potential supply disruptions continue to drive prices higher, particularly amid fears surrounding a possible closure of the Strait of Hormuz. At the same time, expectations that the conflict could stretch into September — reinforced by recent remarks from President Donald Trump indicating there are no set timelines for the war — are further intensifying upward pressure on oil markets.
In contrast, Russian oil exports remain relatively stable after the United States eased certain sanctions related to purchases of Russian crude, a factor that may help partially offset some of the supply risks.
Given the latest market dynamics and the increasingly fragile geopolitical backdrop, crude prices appear capable of testing the psychological $100 per barrel level. Even so, this would still remain below the extreme peaks seen during earlier crises, including the 2022 spike near $130 and the 2008 record around $147.
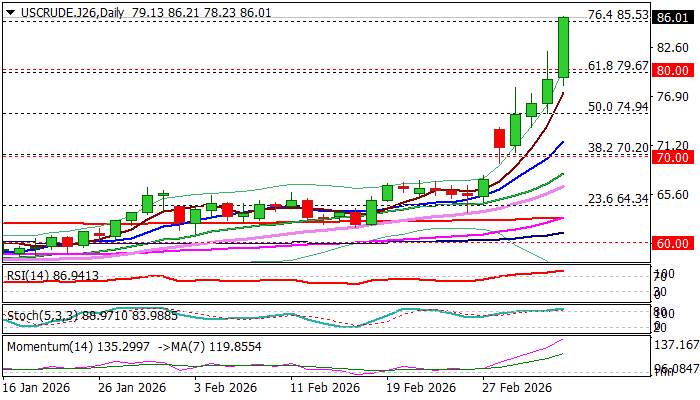
Technically, Friday’s strong upside momentum pushed prices decisively above the psychological $80 threshold and broke through key resistance at $85.53, representing the 76.4% Fibonacci retracement of the $95.00/$54.87 decline from the 2023–2025 downtrend. A sustained move above this level would open the way toward the April 2024 double-top at $87.61 and potentially expose the $90 barrier.
Despite the bullish fundamental backdrop — which remains the primary driver — some consolidation cannot be ruled out in the near term, as daily and weekly indicators are now deeply overbought and traders may look to secure profits toward the end of the week.
However, any pullbacks are expected to remain limited, preserving the broader bullish structure and potentially offering more favorable levels for renewed buying interest.
Former resistance levels at $80 and $79.67, the latter marking the 61.8% Fibonacci retracement of the $95.00/$54.87 decline, have now turned into immediate support zones that should ideally contain any corrective dips.
Res: 86.67; 87.61; 89.38; 90.00
Sup: 84.90; 83.50; 81.80; 80.00