AUDUSD – Daily Chart Shows Emerging Reversal Signal
AUDUSD regained momentum and climbed higher on Thursday, countering the negative impact from Wednesday’s strong rejection just below the base of the rising daily cloud.
Several indicators suggest the pair is attempting to form a base and possibly a reversal pattern on the daily chart. These include Monday’s Hammer candle with a long tail and a potential bear-trap.
A Hammer is also taking shape on the weekly chart, while the long-tailed monthly Doji adds to the evidence that bearish momentum may be waning.
Daily technical studies remain mixed, with the momentum indicator still in negative territory and moving averages in a bearish configuration. However, the thinning and rising daily cloud is drawing attention.
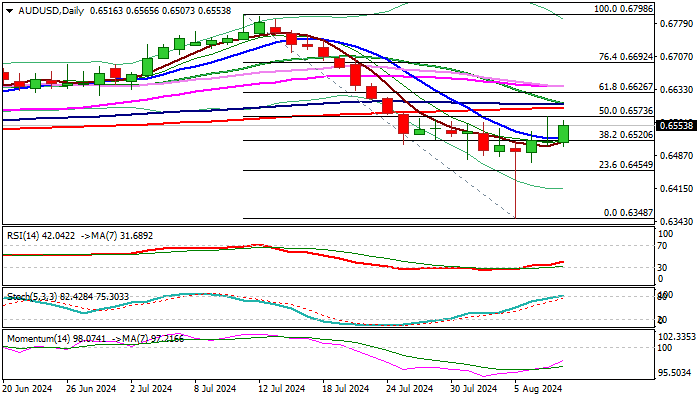
A break above 0.6573 (50% retracement of the 0.6796/0.6348 decline and daily Kijun-sen) is needed to strengthen the positive outlook, paving the way for a retest of the cloud base at 0.6599 and a challenge of the 61.8% Fibonacci retracement at 0.6626.
Maintaining a position above the broken 10DMA at 0.6526 is the minimum requirement to keep near-term bullish momentum intact.
Res: 0.6573; 0.6592; 0.6601; 0.6626
Sup: 0.6526; 0.6507; 0.6472; 0.6455